


What Is Network Telemetry?
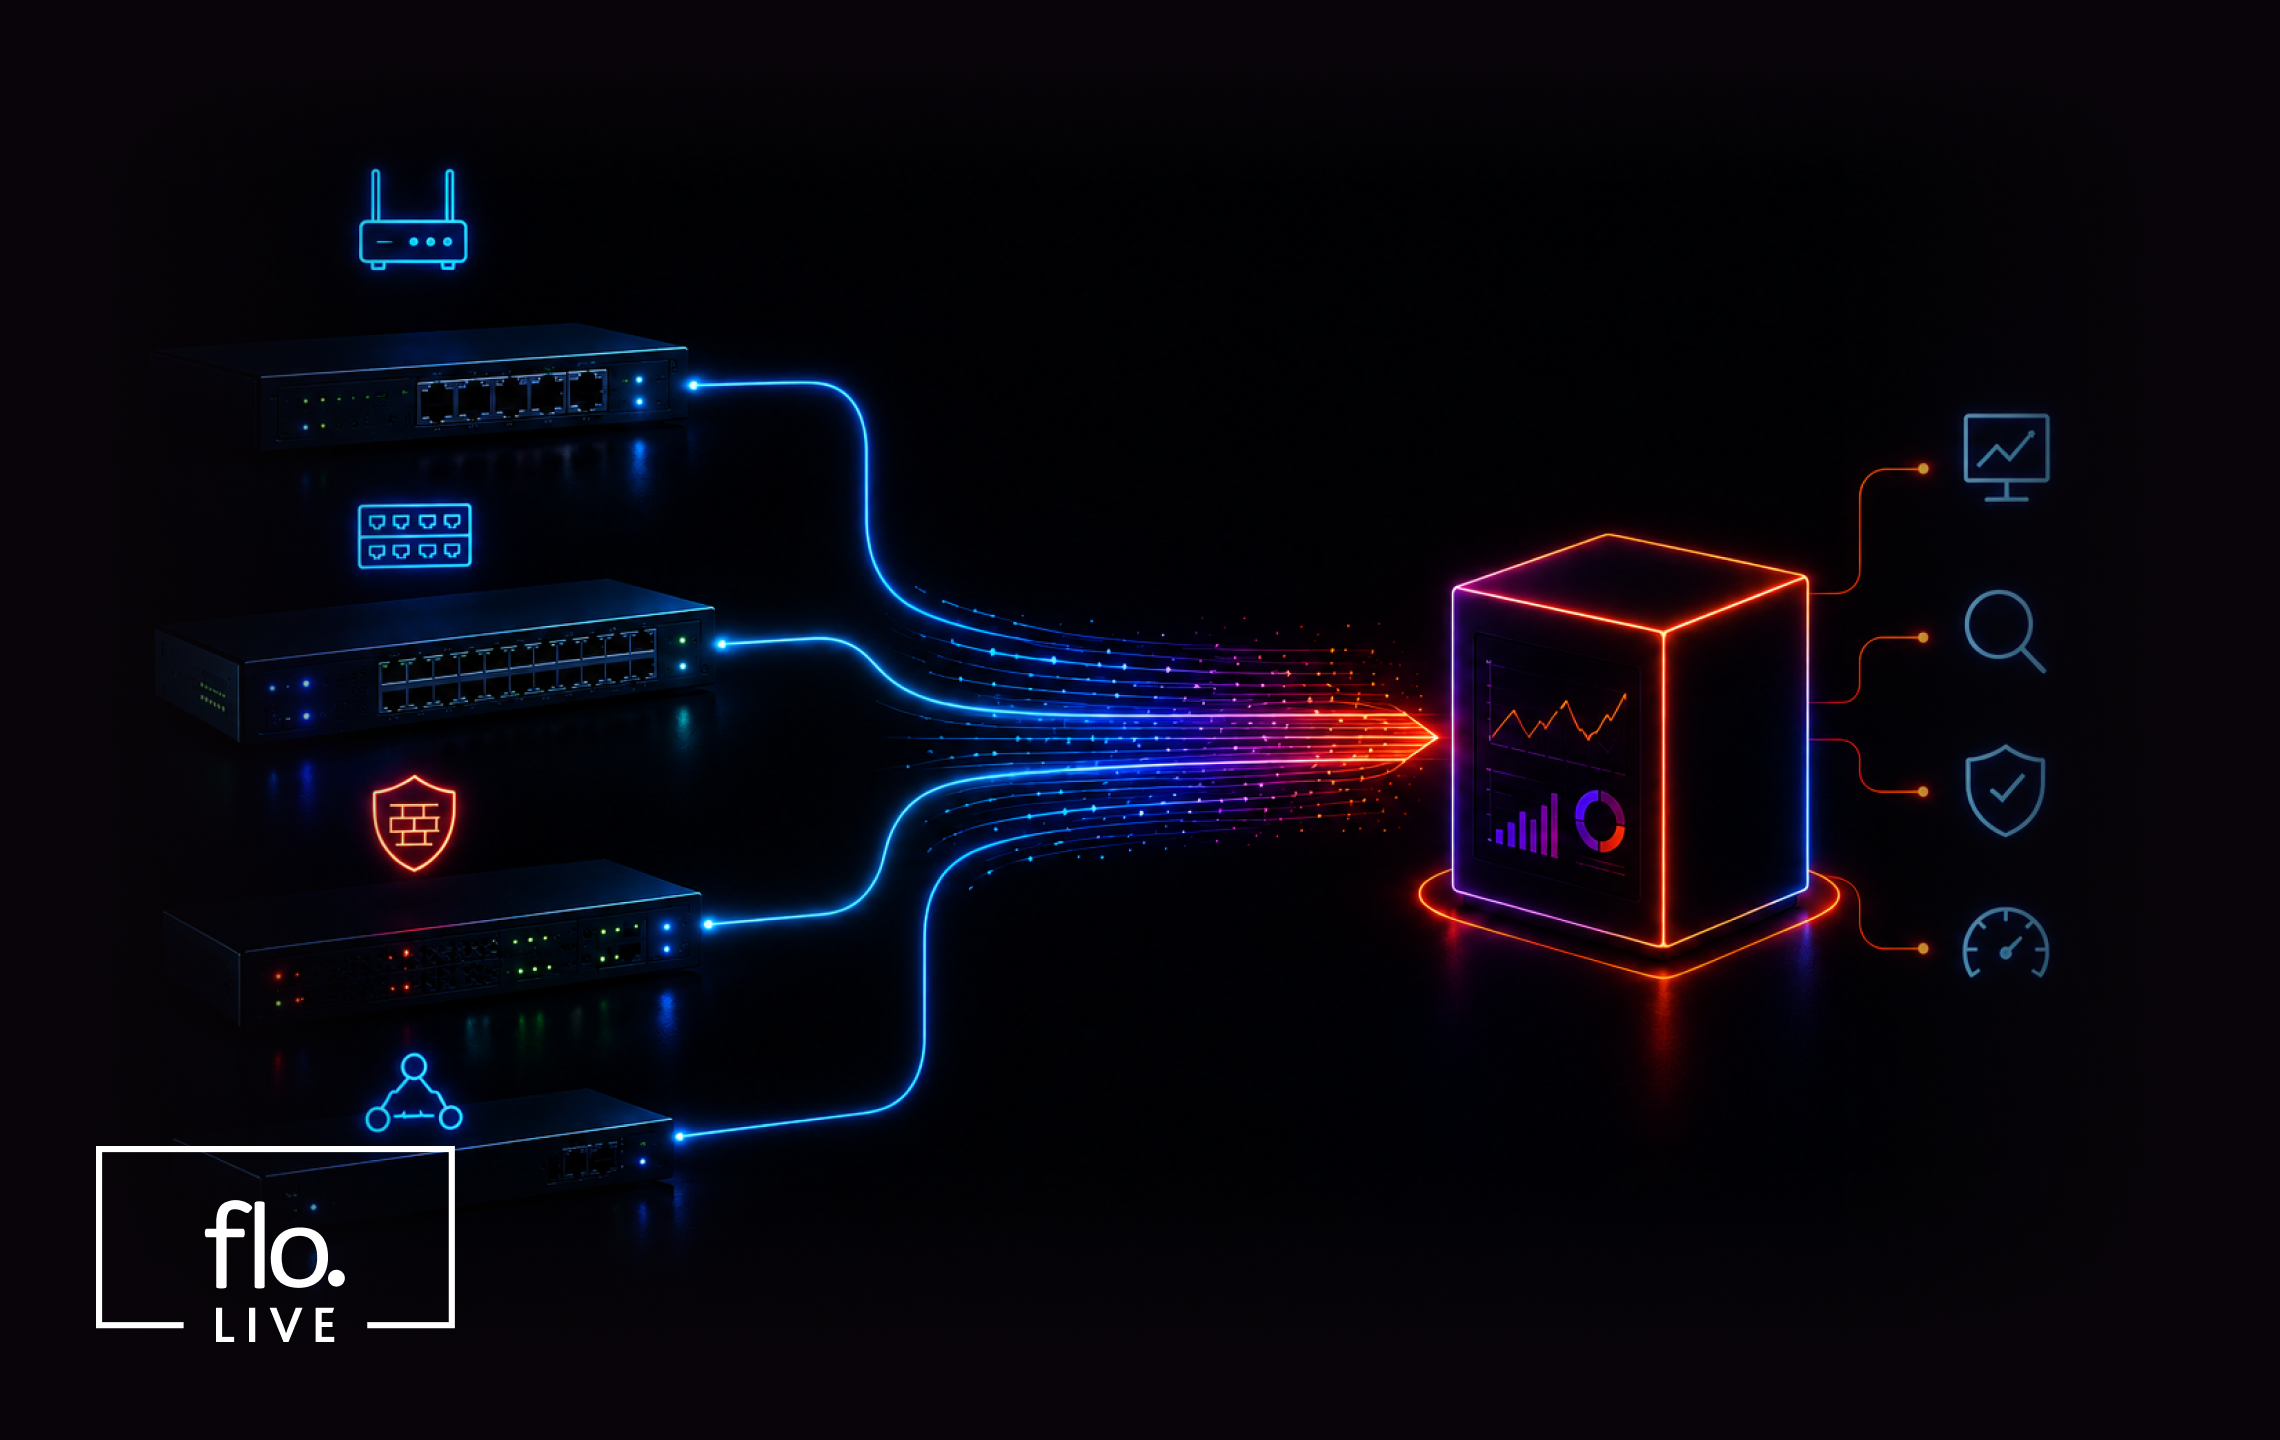
Network telemetry is the continuous, automated collection and streaming of real-time data from network devices (e.g., routers, switches, firewalls) to central analytics platforms. It replaces traditional, periodic polling with instant streaming, allowing IT and security teams to monitor traffic, pinpoint bottlenecks, and detect threats.
Organizations leverage telemetry for several vital use cases:
- IoT and edge network monitoring: Continuously monitors distributed devices, connectivity, and network health to improve reliability and operational visibility.
- Troubleshooting and root-cause analysis: Provides real-time network data to quickly identify, isolate, and resolve performance issues and outages.
- Security monitoring and threat detection: Detects anomalous traffic patterns, unauthorized access, and malicious activity through continuous network visibility.
- Cloud and multi-cloud visibility: Delivers end-to-end visibility across on-premises, cloud, and multi-cloud environments from a unified telemetry platform.
This is part of a series of articles about IoT networking
Network Telemetry vs. Traditional Network Monitoring
Traditional network monitoring typically relies on periodic polling and static thresholds to check the health of devices. This method often uses protocols like SNMP (Simple Network Management Protocol) to collect summary statistics at set intervals. While effective for basic status checks, this approach can miss transient issues and lacks the granularity needed for complex, high-speed networks.
Network telemetry streams detailed metrics and event data in near real time from devices. It provides continuous visibility into network behavior, allowing faster anomaly detection and root-cause analysis. With telemetry, administrators gain deeper insights into performance trends, security events, and operational issues, enabling more agile and informed network management compared to legacy monitoring solutions.
How Network Telemetry Tools Work
1. Data Collection
Network telemetry tools begin by collecting data from a wide range of sources within the network infrastructure. These sources include:In IoT environments, data originates from connected devices and sensors embedded in machines, vehicles, infrastructure, or consumer products. These devices capture information such as temperature, pressure, video streams, location, or user activity. The scale of this data often requires immediate processing to generate insights or trigger automated responses.
- Routers
- Switches
- Firewalls
- Servers
- IoT devices
The data collected can include performance metrics, traffic statistics, logs, and configuration states. Modern telemetry systems often use agents or embedded software within devices to capture this information efficiently, reducing the need for manual intervention and minimizing network overhead.
The granularity and frequency of data collection are critical factors. Unlike legacy systems that might poll devices at fixed intervals, telemetry solutions can collect and transmit data continuously or at high frequencies. This approach enables real-time visibility and allows detection of rapid changes in network conditions, supporting responsive operations and troubleshooting.
2. Data Transport
Once collected, telemetry data must be transported from network devices to centralized analytics systems. This transport is typically accomplished through protocols such as:
- gRPC
- MQTT
- Custom streaming protocols
These protocols handle large volumes of data with minimal latency and overhead, ensuring that data arrives in near real time for processing. Security and reliability are important during data transport. Telemetry systems often use encryption and authentication to protect data in transit and prevent unauthorized access or tampering
Mechanisms for buffering or retrying data transmission help ensure that temporary network disruptions do not result in lost telemetry data, maintaining the integrity of the monitoring process.
3. Data Processing and Enrichment
After transport, telemetry data is ingested by processing engines that aggregate, normalize, and enrich the raw information. Aggregation reduces data volume by summarizing metrics over defined intervals, while normalization ensures consistency across different device types and vendors. Enrichment involves adding context to raw telemetry, such as:
- Device metadata
- Geolocation
- Business relevance
Processing engines may also correlate telemetry data from multiple sources to identify patterns, anomalies, or dependencies within the network. This correlation supports use cases such as root-cause analysis and predictive maintenance. The processed data is then stored in databases or data lakes for querying and visualization by network operators and analysts.
4. Analysis and Visualization
The final stage involves analyzing the enriched telemetry data to extract insights. Analytics platforms apply algorithms, machine learning, or statistical techniques to detect trends, identify anomalies, and predict potential issues. These analyses help network teams make decisions about:
- Capacity planning
- Performance optimization
- Security posture
Visualization tools present telemetry insights through dashboards, charts, and alerts, making complex data easier to interpret. Visualization supports quick diagnosis and response, enabling operators to monitor network health, drill down into events, and generate reports for stakeholders. By integrating analysis and visualization, telemetry tools turn raw data into operational intelligence.
Network Telemetry Collection Methods
SNMP
SNMP (Simple Network Management Protocol) is one of the oldest and most widely used protocols for network monitoring. It operates by periodically polling devices for status information, such as CPU utilization, interface status, and error counts. SNMP is supported by most enterprise network equipment, making it a common baseline for telemetry and monitoring.
Things to consider:
Despite its ubiquity, SNMP has limitations in granularity and real-time capabilities. Its polling-based nature can miss short-lived events and generate network overhead when polling large numbers of devices. Modern telemetry solutions often supplement or replace SNMP with streaming or event-driven methods to achieve higher visibility and responsiveness.
Network Flow Records
Network flow records, such as NetFlow, IPFIX, or sFlow, capture metadata about network traffic flows between endpoints. These records provide information about who is communicating, the volume of data exchanged, and the protocols in use. Flow records are typically generated by routers and switches, offering scalable visibility into large, distributed networks.
Things to consider:
While network flow telemetry is less granular than packet-level monitoring, it balances detail and overhead. Flow data enables use cases like traffic analysis, capacity planning, and threat detection without requiring full packet capture. It is useful in high-throughput environments where collecting every packet is impractical.
Packet-Level Telemetry
Packet-level telemetry involves monitoring individual network packets as they traverse devices. This method can provide detailed insights, including application-level information, latency measurements, and path analysis. Technologies like in-band network telemetry (INT) embed telemetry data directly into packets, allowing real-time monitoring of path characteristics at every hop.
Things to consider:
The detail of packet-level telemetry comes with increased complexity and resource requirements. Capturing, transporting, and processing packet data at scale can be challenging, especially in large networks. As a result, packet-level telemetry is often used selectively for troubleshooting, performance validation, or critical infrastructure monitoring.
Streaming Telemetry
Streaming telemetry is an approach that pushes real-time data from network devices to collectors over persistent connections. Instead of relying on polling, devices continuously stream structured data, often using protocols like gRPC or MQTT. This allows high-frequency, low-latency updates on network health, performance, and events.
Things to consider:
Streaming telemetry supports scalability and granularity. It reduces network overhead compared to polling and enables near-instant detection of issues. This method is widely used in large-scale, dynamic environments such as data centers, cloud networks, and service provider backbones where rapid visibility is required.
Packet Capture
Packet capture involves recording the packets transmitted over the network for later inspection and analysis. Tools like Wireshark or tcpdump allow engineers to analyze protocol behavior, troubleshoot connectivity problems, and investigate security incidents at a granular level. Packet capture provides evidence of network activity for troubleshooting.
Things to consider:
Full packet capture is resource-intensive and can generate large amounts of data, especially on high-speed links. For ongoing telemetry, organizations may use selective packet capture or sampling strategies to balance insight with storage and processing constraints. Packet capture is most effective when combined with other telemetry methods.
Cellular Core and Signaling Records
Cellular networks generate specialized telemetry in the form of core and signaling records, such as CDRs (call detail records) and signaling logs. These records track device registrations, authentication events, handovers, and session management activities across the mobile core network. They provide visibility into device mobility, connectivity health, and service usage in cellular environments.
Things to consider:
For IoT and mobile applications, core and signaling telemetry is important for troubleshooting connectivity, roaming, and network selection issues. These records also support regulatory compliance, billing, and fraud detection. Integrating cellular core and signaling records with other network telemetry provides a complete view of device behavior across heterogeneous network domains.
Common Network Telemetry Use Cases
IoT and Edge Network Monitoring
IoT and edge deployments often span thousands or millions of distributed devices, each with specific connectivity requirements and constraints. Network telemetry enables operators to monitor device status, connectivity quality, and data flows in real time. This visibility supports uptime, anomaly detection, and rapid response in remote or resource-constrained environments.
Telemetry data also supports predictive maintenance and lifecycle management for IoT devices. By analyzing trends in connectivity, battery usage, or sensor readings, organizations can identify devices at risk of failure and schedule proactive interventions. This reduces operational costs and improves the reliability of IoT and edge networks.
Troubleshooting and Root-Cause Analysis
Network telemetry provides granular, time-stamped data that accelerates troubleshooting and root-cause analysis. When a performance issue or outage occurs, telemetry helps pinpoint the affected devices, interfaces, and traffic flows. Operators can correlate events across multiple layers, such as network, application, and security, to isolate the cause.
With access to historical telemetry, teams can reconstruct incidents and analyze patterns leading up to failures. This enables effective remediation and reduces the mean time to repair (MTTR). By automating the collection and correlation of diagnostic data, telemetry improves the troubleshooting process and service reliability.
Security Monitoring and Threat Detection
Network telemetry supports detection of security threats by providing continuous visibility into network activity. Real-time metrics, flow records, logs, and packet data can reveal unusual behavior such as unexpected traffic spikes, lateral movement, command-and-control communication, or unauthorized access attempts. Because telemetry is collected continuously, security teams can identify and investigate suspicious activity before it develops into a larger incident.
Telemetry also improves incident response by supplying the context needed to understand how an attack unfolded. By correlating network telemetry with endpoint, identity, and application data, security platforms can detect complex attack patterns and reduce false positives. This supports threat hunting, automated alerting, and containment of security incidents.
Cloud and Multi-Cloud Visibility
Many organizations operate workloads across multiple cloud providers and on-premises infrastructure, which makes end-to-end visibility more difficult. Network telemetry provides a consistent way to collect performance and connectivity data from these environments. By aggregating telemetry into a central platform, operators can monitor traffic flows, application performance, and network health across hybrid and multi-cloud deployments.
This visibility helps teams identify bottlenecks, configuration issues, and connectivity problems that span cloud boundaries. It also supports capacity planning, cost optimization, and compliance by showing how network resources are used across environments. With consistent telemetry from all infrastructure, organizations can manage complex cloud networks and maintain reliable application performance.
Best Practices for Network Telemetry in Global IoT Deployments
Here are some important practices to consider when using network telemetry in IoT systems.
1. Collect Telemetry Across the Connectivity Stack
Global IoT connectivity depends on multiple layers, including the device modem, SIM or eSIM, radio access network, mobile core, internet transport, and application endpoint. Telemetry should cover each layer so teams can distinguish between device faults, coverage problems, operator issues, and application failures.
Collect metrics such as signal strength, registration status, network selection, session establishment, DNS performance, latency, packet loss, and application reachability. Correlating these signals provides a complete view of the connection path and reduces the time required to isolate failures.
Key actions:
- Monitor telemetry from device to application.
- Collect signal, latency, and packet loss metrics.
- Correlate network and application events.
- Continuously validate connectivity health.
2. Centralize Multi-Operator Visibility
Global deployments often rely on multiple mobile network operators, roaming partners, and connectivity providers. Each may expose different portals, data formats, and performance metrics. A centralized telemetry platform should normalize this information into a common operational view.
Centralization allows teams to compare network performance by operator, country, device type, or service profile. It also helps identify regional outages, roaming failures, and operator-specific degradation without switching between management systems.
Key actions:
- Aggregate telemetry from all operators.
- Normalize metrics into a common format.
- Compare performance across regions and providers.
- Create unified dashboards and alerts.
Related content: Read our article about IoT connectivity management platforms
3. Add Device and Business Context
Raw network metrics are more useful when linked to device and business data. Telemetry records should include context such as device model, firmware version, SIM profile, customer, location, deployment group, and application role.
This context helps teams measure the business impact of network events. For example, a connectivity failure affecting payment terminals may require a faster response than the same failure affecting noncritical sensors. Context also supports targeted remediation, trend analysis, and service-level reporting.
Key actions:
- Enrich telemetry with device metadata.
- Associate devices with business services.
- Group metrics by location and deployment.
- Prioritize incidents by business impact.
4. Monitor Signaling as Well as Data Usage
Data usage alone does not show whether a device is connecting reliably. Devices may consume little data while repeatedly registering, authenticating, attaching, or establishing sessions. These signaling events can reveal coverage problems, modem faults, roaming restrictions, or inefficient firmware behavior.
Monitor registration attempts, authentication failures, attach success rates, session setup failures, handovers, and network reject codes. Tracking signaling patterns helps detect unstable devices and prevents excessive signaling from increasing battery use, network load, or operational costs.
Key actions:
- Track registration and authentication events.
- Monitor attach and session success rates.
- Alert on abnormal signaling behavior.
- Analyze network reject codes and handovers.
5. Design for Multi-Network Resilience
IoT devices deployed globally should be able to recover when a preferred network becomes unavailable or performs poorly. Telemetry should verify whether devices can detect failures, select an alternative network, restore sessions, and resume application traffic without manual intervention.
Resilience strategies may include multi-operator SIMs, eSIM profile switching, local breakout, fallback access technologies, and application-level retry logic. Teams should test these mechanisms under realistic failure conditions and monitor switching time, session recovery, and data continuity across regions.
Key actions:
- Support multi-operator connectivity.
- Test automatic failover between networks.
- Monitor session recovery after outages.
- Validate roaming and cross-border performance.
Gaining Real-Time IoT Network Telemetry and Visibility with floLIVE
The floLIVE cloud-based Connectivity Management Platform (CMP) gives MNOs, MVNOs, and enterprises instant IoT control, real-time visibility, and global compliance from a single interface. Rather than offering dashboards and metrics alone, the telco-grade CMP is a fully integrated, cloud-native platform that connects directly to floLIVE’s dedicated core network, advanced SIM technologies, real-time billing engine, and global coverage infrastructure, delivering granular control, intelligent automation, and actionable insight at scale.
Key capabilities of the floLIVE CMP:
- Real-time visibility and control: Monitor SIM status, data usage, location, and performance in real time, activate or suspend devices instantly, apply policies dynamically, and troubleshoot with one-click diagnostics.
- Network diagnostics and usage alerts: Access real-time SIM status and network diagnostics alongside global and local usage monitoring with alerts.
- Policy and profile management: Manage QoS, roaming, and usage limits across the connected fleet, with SIM lifecycle automation to activate, suspend, or terminate devices.
- API-first architecture: Use robust REST APIs to embed SIM management, data, and diagnostics directly into your own applications, CRMs, and operational tools.
- Multi-tier architecture: Support resellers, enterprise accounts, and multi-tenant business models with granular permission management, usage segregation, role-based access, and audit logs.
- Built for scale: Operate from dozens to millions of devices, with bulk actions and an integrated OSS/BSS suite that simplifies operations, billing, and support.
- Optional CMP aggregator: Unify all your SIMs, including SGP.32, from any provider under a single platform, adding a single pane of glass to manage legacy and multi-vendor fleets without replacing SIMs.
Transforming Network Telemetry into AI-Powered Intelligence
The continuous, real-time telemetry ensuring device connectivity and network health now serves as the architectural foundation for a sophisticated generation of AI-enhanced insights within the floLIVE CMP. New features—such as floLIVE Operational Insights (focused on technical and SLA metrics) and floLIVE Business Insights (tracking fleet expansion, expenditures, and revenue)—leverage AI to analyze telemetry and data usage. This allows for the automated identification of trends and anomalies, providing plain-language intelligence without the need for manual report generation. These advancements represent a core component of floLIVE’s strategic roadmap for AI-driven, telemetry-centric CMP functionality.
Learn more about the floLIVE Connectivity Management Platform